
eBPF is a popular and powerful technology embedded in the Linux kernel. It is widely used by many security tools for monitoring kernel activity to detect and protect organizations. eBPF, however, can potentially be a dual edged sword as it can be used by threat actors as part of their malicious arsenal. Lately, we have seen a rise in the number of eBPF based tools used for malicious goals such as rootkits (ebpfkit, TripleCross) and malwares (pamspy). In this blog we explain how eBPF is used to instrument the kernel and demonstrate how we detected malicious usage of the eBPF.
Understanding pamspy – eBPF malware
Pamspy is a Linux malware designed to collect credentials by leveraging eBPF technology to track user-space functions inside the Pluggable Authentication Modules (PAM) library. PAM is used by many critical applications to handle authentication (such as sudo, sshd, passwd etc.) and thus it allows attackers to collect clear text credentials.
By utilizing eBPF uprobes technology “Pamspy is hooking the pam_get_authtok ()function from libpam.so. The pam_get_authtok()function is responsible for returning the user authentication token, which includes the clear text username and password of the user. Next, future authentication “requests will call pam_get_authtok()function, and since Pamspy has hooked this function, it can now collect clear text credentials in the system.
Since Pamspy is using an eBPF program to steal secrets, traditional security controls that focus on the user-space may completely miss this malware. Thus, we wish to show you how eBPF technology is used by security tools such as Aqua Tracee to overcome this problem and detect eBPF malwares and rootkits.
Harnessing eBPF to detect malicious eBPF
We aim to detect tools that are using eBPF technology to monitor the system. Some malicious tools monitor kernel functions (for instance file system writes, resources enumeration), while others monitor user-space functions to collect sensitive data such as passwords.
We can use eBPF program to detect malicious eBPF use. But we’ve discovered that for security purposes it’s not enough to just detect the load of a eBPF program, because the obtained information lacked the context of which system events trigger the eBPF program. Thus, we found a solution by utilizing Perf events to obtain the missing context information.
But first let’s set a background about what is eBPF and what are Perf events.
In general, eBPF programs are small blocks of code that are triggered by events within the system. They serve to extend the functionality of the Linux kernel but have certain limitations on what they can accomplish. Primarily, they are used for tracing purposes. The kernel incorporates mechanisms to create and load these programs, restrict them from performing undesirable actions, and ensure they do not cause crashes.
eBPF programs can be associated with various events in the system, such as resource allocation, socket operations, kernel events, and networking. However, in this article, our focus is on kernel instrumentation, specifically monitoring kernel operations.
To enable performance monitoring and kernel instrumentation, Perf events were introduced into the kernel. They serve as means to probe specific points within the kernel, enabling system monitoring, troubleshooting, and tracing. Perf events are utilized to monitor kernel operations and performance metrics, such as CPU consumption, measurement counting, and more. These events can be triggered either by system events or periodically to sample desired information.
When considering the interaction between eBPF programs and Perf events, eBPF programs can be triggered by Perf events. While eBPF programs can typically be attached to numerous system events, we will concentrate on five specific events in this blog:
- Tracepoints: These are predefined strategic points in the kernel that offer valuable information about the ongoing execution of the kernel.
- Kprobes: These are dynamically defined points in the kernel that provide useful information for the person who sets them, usually upon function entry.
- Kretprobes: Similar to kprobes, these points are defined dynamically in the kernel but trigger upon function exit.
- Uprobes: Similar to kprobes, but designed for user-space programs rather than the kernel.
- Uretprobes: Similar to kretprobes, but intended for user-space programs.
By leveraging these probes using Perf, eBPF programs can effectively trace and monitor the specified areas within the kernel, providing valuable insights into system behavior and performance.
Triggering eBPF programs with Pref events
To gain a deeper understanding of how eBPF and Perf interact, we will explore the process of setting up triggers for eBPF programs. At a higher level, the following steps need to be taken:
- Open a Perf event: Begin by initiating a Perf event, which serves as the trigger for our eBPF program.
- Load an eBPF program: Develop an eBPF program that contains the desired functionality or logic. Once created, load the program into the system.
- Attach the Perf event to the eBPF program: Establish a connection between the Perf event and the eBPF program by associating the two. This ensures that the eBPF program is triggered whenever the designated Perf event occurs.
By following these steps, we can effectively set up the necessary connections between Perf events and eBPF programs, allowing us to monitor and trace specific behaviors within the system.
Step 1: Opening Perf events
As mentioned above we focus on 5 Perf events for kernel instrumentation with eBPF (tracepoints, k(ret)probes, u(ret)probes).
Tracepoints already exist in the system so the user does not need to create them. You can simply open them using the pref_event_open() syscall. As for the k(ret)probes/u(ret)probes, they’re not existing apriory in the system and thus you need to create them. If you are using the kernel version 4.17 and above, perf_event_open() syscall can create the probes for you. But if you’re using lower kernel versions you need to create them with a legacy option which will be described next:
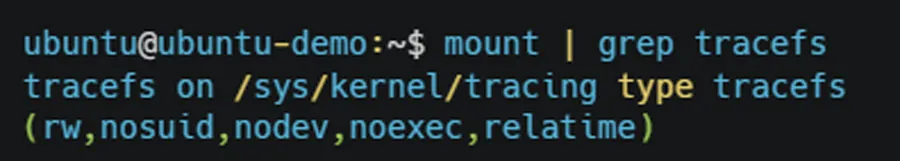
1. The k(ret)probes or u(ret)probes are created separately using the tracefs under /sys/kernel/tracing/ (or /sys/kernel/debug/tracing/ for old kernels).
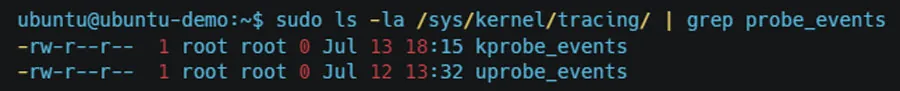
2. In order to create a k(ret)probe event or a u(ret)probe event, you can write to /sys/kernel/tracing/kprobe_events and /sys/kernel/tracing/uprobe_events respectively.
3. Using the right format for each event type, the kernel will create the probe for you with the required options.
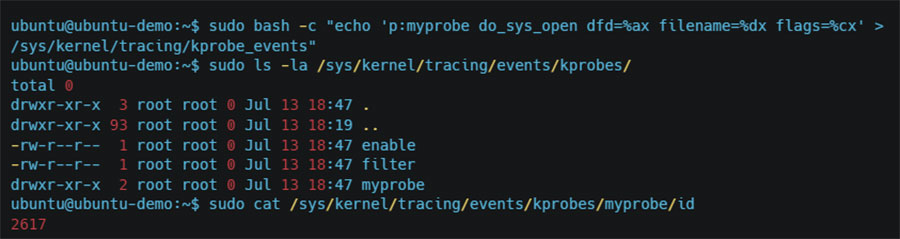
4. Then you’ll need to open the Perf event using the perf_event_open() syscall, and provide it with the id of the probe you created earlier.
While there are little apparent differences between the legacy creation of k(ret)probes/u(ret)probes and invoking the perf_event_open() syscall, one difference that should be known to the user (i.e. the monitoring tool), is the event name, as mentioned below:
- In the legacy option, the name for the Perf event is the name of the
k(ret)probe/u(ret)probegiven by the user in thetracefs. - In the syscall option it is set by the kernel.
Step 2: eBPF program
As for eBPF programs and the 5 Pref events in focus (tracepoint, k(ret)probe or u(ret)probe), there are two relevant program types:
- BPF_PROG_TYPE_TRACEPOINT – for Perf event of type tracepoint
- BPF_PROG_TYPE_KPROBE – for Perf event of type k(ret)probe or u(ret)probe.
Loading an eBPF program is done using the bpf() syscall with BPF_PROG_LOAD command. In this case the program is of type BPF_PROG_TYPE_KPROBE.

Step 3: Attaching eBPF to Perf
For kernel version 5.7 and above, you can utilize the bpf() syscall to link between the eBPF program you just loaded and the Pref event. All you need to do is to use the bpf() syscall command BPF_LINK_CREATE. For older kernel versions that do not support this command, however, you need to use the ioctl() syscall with the command PERF_EVENT_IOC_SET_BPF.
In newer kernel versions, both options are available, and provide the same result of triggering the eBPF program when the Perf event hits.
A nice example of that is implemented in libbpf which takes care of this process:
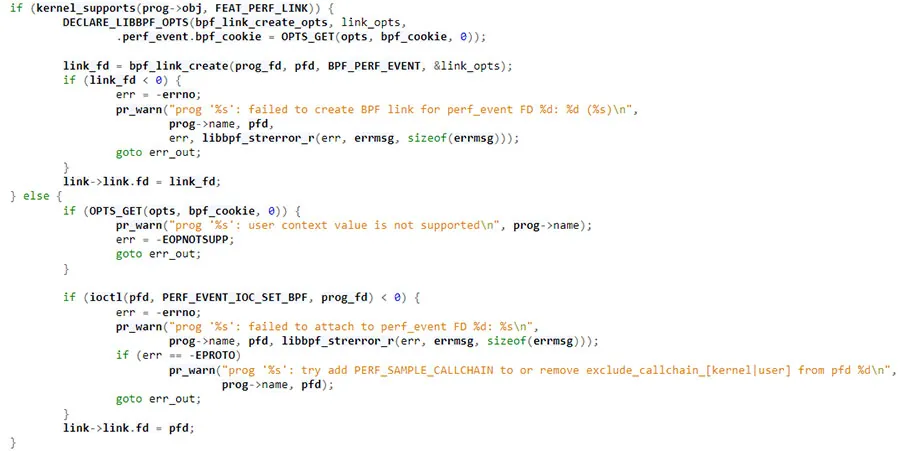
https://elixir.bootlin.com/linux/v6.3.7/source/tools/lib/bpf/libbpf.c#L9750
If the kernel supports BPF_LINK_CREATE, it uses this option to create the link, otherwise, it uses ioctl() with PERF_EVENT_IOC_SET_BPF.
Combining the eBPF and Pref events data
Now we can merge the Perf events data (which stores information about the event symbol name and whether it’s a kprobe or a uprobe, whether it’s a return probe) and the eBPF data (eBPF program name, eBPF helpers… etc) into the full picture of how eBPF program is instrumenting the kernel.
Aqua Tracee – Out-of-the-box detection
After we learned to combine the outputs of eBPF and Perf events, we implemented this knowledge into Aqua Tracee, to detect malicious tools that are using eBPF to monitor the system.
Below you can see a screenshot of a detection of Pamspy in Tracee. As mentioned above, this eBPF malware is designed to collect passwords by hooking to the pam_get_authtok function from libpam.so. In the detection below you can see the eBPF program name trace_pam_get_a (it is truncated in the kernel). It is attached to a uretprobe – user-space return probe. The uretprobe is on user-space library /lib/x86_64-linux-gnu/libpam.so.0 with the offset 34992 which leads to pam_get_authtok function with the clear text username and password.
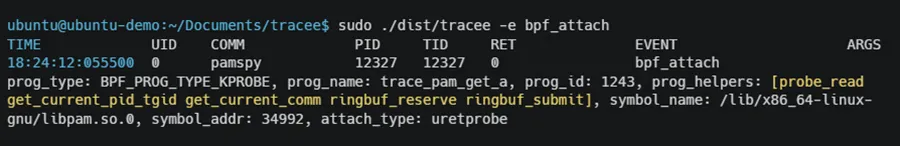
You can read more about the Tracee event bpf_attach, here.