Remove Load Balancer Remove Metrics Remove Virtualization Remove WAN
article thumbnail

Announcing Complete Azure Observability for Kentik Cloud

Kentik

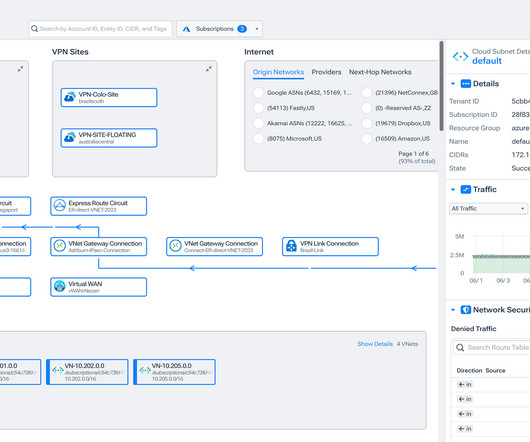
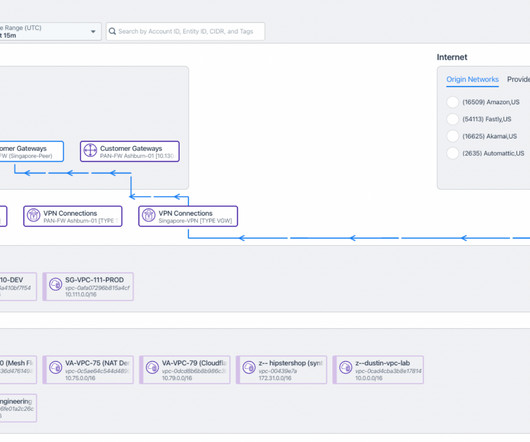
Kentik customers move workloads to (and from) multiple clouds, integrate existing hybrid applications with new cloud services, migrate to Virtual WAN to secure private network traffic, and make on-premises data and applications redundant to multiple clouds – or cloud data and applications redundant to the data center.

Azure 105
article thumbnail

The Network Also Needs to be Observable, Part 2: Network Telemetry Sources

Kentik

We see these DevOps teams unifying logs, metrics, and traces into systems that can answer critical questions to support great operations and improved revenue flow. Traditional WAN : WAN access switches, integrated services routers, cloud access routers. Application layer : ADCs, load balancers and service meshes.

Network 128
Insiders

Sign Up for our Newsletter

This site is protected by reCAPTCHA and the Google Privacy Policy and Terms of Service apply.

article thumbnail

Optimizing Network Stability and Reliability Through Data-Driven Strategies

Kentik

If you think about everything application traffic flows through between its source and destination, the sheer variety and volume of physical and virtual devices are enormous. We have flow records, security tags, SNMP metrics, VPC flow logs, eBPF metrics, threat feeds, routing tables, DNS mappings, geo-id information, etc.

Network 52
article thumbnail

Closing the Network Performance Monitoring Gap and Achieving Full Network Visibility

Kentik

Until just a few years ago, enterprise networks were predominantly comprised solely of one or more private data centers connected to a series of campuses and branch offices by a private WAN that was based on MPLS VPN technology from a major telecom carrier. And even virtual appliances become impractical to employ effectively.

Network 40
article thumbnail

Practical Steps for Enhancing Reliability in Cloud Networks - Part I

Kentik

When evaluating solutions, whether to internal problems or those of our customers, I like to keep the core metrics fairly simple: will this reduce costs, increase performance, or improve the network’s reliability? It’s often taken for granted by network specialists that there is a trade-off among these three facets. Resiliency.

Network 104
article thumbnail

Using Device Telemetry to Answer Questions About Your Network Health

Kentik

For cloud network specialists, the landscape for their observability efforts includes a mix of physical and virtual networking devices. Traditional network monitoring relies on telemetry sources such as Simple Network Messaging Protocol (SNMP), sFlow, NetFlow, CPU, memory, and other device-specific metrics. What is network telemetry?

Network 97
article thumbnail

eBPF Explained: Why it's Important for Observability

Kentik

eBPF, which stands for Extended Berkeley Packet Filter , is a lightweight virtual machine that can run sandboxed programs in a Linux kernel without modifying the kernel source code or installing any additional modules. This isn’t necessarily a bad thing, but it isn’t the same as collecting metrics on the application’s activity itself.