article thumbnail

Techniques and approaches for monitoring large language models on AWS

AWS Machine Learning - AI

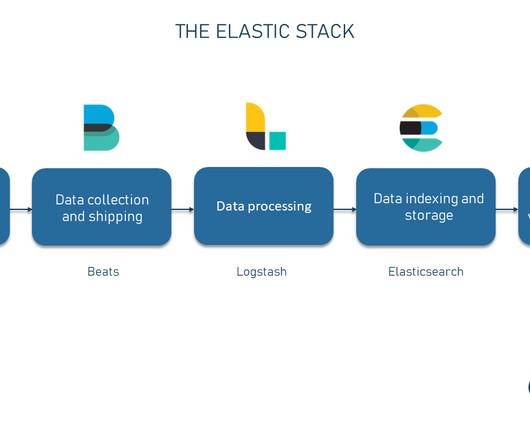
Our proposed architecture provides a scalable and customizable solution for online LLM monitoring, enabling teams to tailor your monitoring solution to your specific use cases and requirements. Overview of solution The first thing to consider is that different metrics require different computation considerations.

article thumbnail

Nightfall raises cash for its AI that detects sensitive data across apps

TechCrunch

Madan says he and Sathe were inspired to launch Nightfall by Sathe’s personal experiences with data breaches arising from poor “data security hygiene.” This has led to the proliferation of cloud applications that house data that is completely opaque to security teams and increases the attack surface area.”

Insiders

Sign Up for our Newsletter

This site is protected by reCAPTCHA and the Google Privacy Policy and Terms of Service apply.

article thumbnail

Observability, Telemetry, and Monitoring: Learn About the Differences

Honeycomb

Over the past five years, software and systems have become increasingly complex and challenging for teams to understand. It relies on telemetry data (such as logs, metrics, traces, profiles, and events) and analysis tools, such as Honeycomb. Let’s go through some quick definitions before we dive into the details. What is observability?

Metrics 87
article thumbnail

Improved Alerting with Atlas Streaming Eval

Netflix Tech

In other words, false positives are bad but false negatives are the absolute worst! A few years ago, we were paged by our SRE team due to our Metrics Alerting System falling behind — critical application health alerts reached engineers 45 minutes late!

Metrics 115
article thumbnail

The Good and the Bad of Microsoft Power BI Data Visualization

Altexsoft

One of the important steps away from spreadsheets and towards developing your BI capabilities is choosing and implementing specialized technology to support your analytics endeavors. Microsoft Power BI is an interactive data visualization software suite developed by Microsoft that helps businesses aggregate, organize, and analyze data.

article thumbnail

The University of Phoenix and Expedient: Making the Transformation from a Legacy Datacenter to Software-Defined Excellence

CIO

The team had also accumulated a lot of technical debt over the years as they implemented workarounds out of necessity that later became unwieldy.”. For years, the IT team worked to get by, but it was getting tough just to keep things running. Our team questioned if we could pull it off. It energized the entire team.”.

Software 263
article thumbnail

Improving Decision Making by 75% using Supply Chain Visualization

Sunflower Lab

Often, data can be altered by various team members, leading to discrepancies and disruptions in information flow to stakeholders. These dashboards can be designed to display key performance indicators (KPIs), track metrics, and monitor supply chain network in real-time.